- grahamdraby
- Jun 22, 2023
- 2 min read
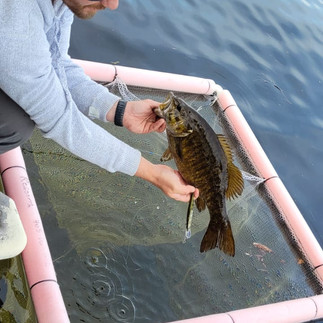
This spring, our team led by PhD student Amber Fedus, along with Dr. Jake Brownscombe and Kurt Smith from DFO, worked long days over many weeks to put a whopping 153 new transmitters into fish on Stoney Lake. We are now up to 215 fish (!!) that have been implanted with transmitters. The overall tally includes 79 walleye, 69 smallmouth bass, 36 yellow perch, 23 black crappie, and 8 muskellunge. It was a huge team effort; nearly every member of the Raby Lab spent time in the field helping Amber, Jake, and Kurt. Special thanks to Brent Whetung for catching walleye for us, to Ben and Viamede Resort for use of their docks, and to Ed Paleczny and Jackie Ouellette who also let us use their property.

(Left) The research team from this spring.
The tagging season wasn’t without its challenges. Many long days and nights of angling and electrofishing, often to catch very few of our target species. A heatwave in May surged water temperatures, not an ideal condition for fish survival. We adapted by tagging the fish at night when it was cooler, using cold water pumped from deep.
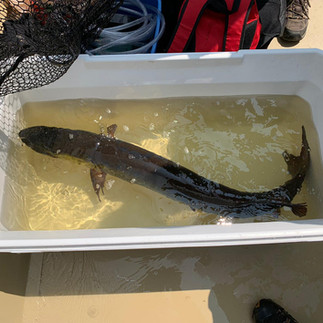
We notably struggled to locate muskies, known as the 'fish of 10,000 casts'. Nevertheless, we tagged six more, taking our total to eight. Muskies Canada Inc. and the Kawartha Lakes Chapter have generously contributed a combined $6500 for purchasing transmitters. They also arranged a muskie fishing day for us (to catch fish for tagging), which, due to the heatwave, had to be canceled to avoid risk to the muskies. We plan to reschedule it for October, with the help of volunteer anglers and will further aim to catch more muskies next spring during their spawning period.
A couple of individuals have reported finding tagged fish – an encouraging sign. The walleye bear a conspicuous external loop tag on their back (see video), marked with my contact number and a unique ID. Other species don't have external tags, but a recent tagging will reveal an incision site on their underside. The tagged fish are safe to consume and if a transmitter is returned, we can repurpose it for another fish. If you come across someone unsure about what to do with a tagged fish, don't hesitate to direct them to me at grahamraby@trentu.ca.
This week, we've begun extracting underwater receivers to gather fish detection data, a process that will span a couple weeks. After a quick battery change, we re-deploy the receivers in their original spots, concealed 6+ feet below the surface. We'll then start the demanding task of organizing millions of data points and beginning to decipher the activities of our aquatic subjects. Keep an eye on this space for more updates!